

Market By Products, Application And Geography | Forecast 2019-2027
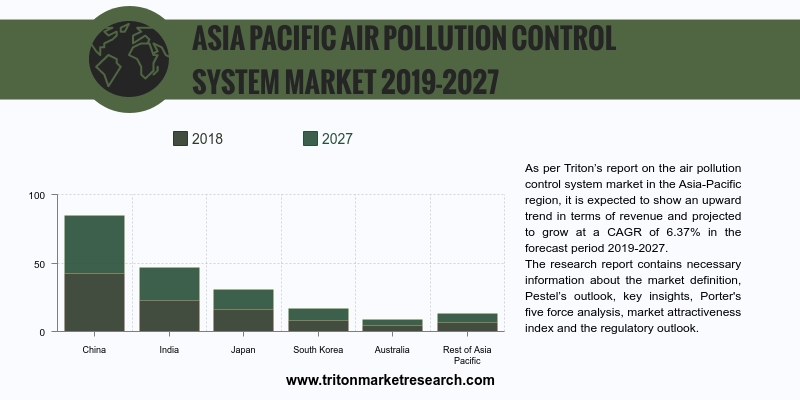
As per Triton’s report on the air pollution control system market in the Asia-Pacific region, it is expected to show an upward trend in terms of revenue and projected to grow at a CAGR of 6.37% in the forecast period 2019-2027.
The countries that have been studied in this report on the Asia-Pacific market are:
O India
O China
O Japan
O South Korea
O Australia
O New Zealand
O ASEAN countries
O Rest of Asia Pacific

Report scope can be customized per your requirements. Request For Customization
The key factor responsible for the growth of this market is the rising population in this region. Rapid urbanization has led to crowding in cities, and thus the quality of air in these places has also deteriorated. Operational processes in industries emit gaseous particulates that severely adulterate air quality. Several gases such as SO2, CO, CO2, N2O, particulates, ozone, volatile organic compounds, CFCs, unburned hydrocarbons, lead, heavy metals, etc., heavily contribute to air pollution.
India is one of the most polluted countries in this region, with six of its cities being listed in the world’s most polluted cities list. Due to deteriorating air quality, alternative solutions are now being explored along with several other cleanliness initiatives. In an effort to improve the quality of air, the government is offering financially viable options to service providers and investors so that they can comply with environmental regulations.
Over the last few years, the amount of electricity generated from coal has declined globally; in spite of this, the energy companies in emerging countries in the APAC region continued to build new coal-fired power plants. The reason for this being, a large number of areas in these countries having no access to electricity and the high coal production in this region. Air pollution from coal is responsible for premature deaths, and the number is only expected to rise. Installing emission control systems becomes imperative for these regions to keep air pollution in check and this increase in the newly installed coal power plants presents an opportunity for the growth of the air pollution control system market.
It is the responsibility of the owner to ensure the safety of its workers, employees and surroundings. Government laws bind them to install safety systems in the industry. However, high capital costs, requirement of skilled labor and the need for periodic maintenance along with the risks associated with these safety systems and the stringent regulations by the government have made the end users skeptical about adopting air pollution control systems.
This report provides a detailed study of the market definition, key industrial insights, regulatory components, market opportunities insights, vendor scorecard, Porter’s five force analysis and the key impact analysis.
Companies such as FLSmidth & Co., A/S, Zhejiang Feida Environmental Science & Technology Co., Ltd., Siemens AG, John Wood Group PLC, Babcock & Wilcox Enterprises, Inc., Mutares AG, Southern Erectors, Inc., Beltran Technologies, Inc., Elex AG, Thermax Asia-Pacific, S.A. Hamon, Mitsubishi Hitachi Power Systems, Ltd., KC Cottrell Co., Ltd. and Fujian Longking Co., Ltd. are well-known in the air pollution control systems market.
1. AIR
POLLUTION CONTROL SYSTEM MARKET - SUMMARY
2. INDUSTRY
OUTLOOK
2.1. MARKET
DEFINITION
2.2. KEY
INSIGHTS
2.2.1. HEALTH
PROBLEMS DUE TO AIR POLLUTION
2.2.2. REGULATIONS
ON MERCURY AND AIR TOXIC STANDARDS
2.3. PORTER’S
FIVE FORCE ANALYSIS
2.3.1. THREAT
OF NEW ENTRANTS
2.3.2. THREAT
OF SUBSTITUTES
2.3.3. BARGAINING
POWER OF SUPPLIERS
2.3.4. BARGAINING
POWER OF BUYERS
2.3.5. THREAT
OF COMPETITIVE RIVALRY
2.4. KEY
IMPACT ANALYSIS
2.4.1. COST
2.4.2. REGULATORY
STANDARDS
2.4.3. COST
BENEFIT RATIO
2.5. MARKET
ATTRACTIVENESS INDEX
2.6. VENDOR
SCORECARD
2.7. INDUSTRY
COMPONENTS
2.8. REGULATORY
FRAMEWORK
2.9. MARKET
DRIVERS
2.9.1. GOVERNMENT
REGULATIONS
2.9.2. POPULATION
GROWTH
2.9.3. INCREASING
AIR POLLUTION
2.10. MARKET RESTRAINTS
2.10.1. DECREASING INVESTMENTS IN COAL
POWER PLANTS BY DEVELOPED REGIONS
2.10.2. DEVELOPMENTS IN RENEWABLE
ENERGY MARKET
2.11. MARKET OPPORTUNITIES
2.11.1. NEW THERMAL POWER PLANTS
INSTALLATION IN CHINA AND INDIA
2.11.2. OPPORTUNITIES FROM INDUSTRIAL
SECTOR OF EMERGING COUNTRIES
2.11.3. GROWING NEED FROM CEMENT
INDUSTRIES
2.12. MARKET CHALLENGES
2.12.1. LOW INVESTMENT IN SAFETY
SYSTEM
2.12.2. COST INVOLVED IN INSTALLATION
AND MAINTENANCE OF SYSTEM
3. AIR
POLLUTION CONTROL SYSTEM MARKET OUTLOOK - BY PRODUCTS
3.1. SCRUBBERS
3.2. THERMAL
OXIDIZERS
3.3. CATALYTIC
CONVERTORS
3.4. ELECTROSTATIC
PRECIPITATORS
3.5. OTHERS
4. AIR
POLLUTION CONTROL SYSTEM MARKET OUTLOOK - BY APPLICATION
4.1. CEMENT
4.2. IRON
& STEEL
4.3. CHEMICAL
4.4. POWER
GENERATION
4.5. OTHERS
5. AIR
POLLUTION CONTROL SYSTEM MARKET - REGIONAL OUTLOOK
5.1. ASIA-PACIFIC
5.1.1. MARKET
BY PRODUCTS
5.1.2. MARKET
BY APPLICATION
5.1.3. COUNTRY
ANALYSIS
6. COMPETITIVE
LANDSCAPE
6.1. BABCOCK
& WILCOX ENTERPRISES, INC
6.2. MUTARES
AG
6.3. ELEX
AG
6.4. FLSMIDTH
& CO. A/S
6.5. ZHEJIANG
FEIDA ENVIRONMENTAL SCIENCE & TECHNOLOGY CO., LTD.
6.6. KC
COTTRELL CO., LTD
6.7. S.A.
HAMON
6.8. BELTRAN
TECHNOLOGIES, INC.
6.9. JOHN
WOOD GROUP PLC
6.10. SOUTHERN ERECTORS, INC.
6.11. MITSUBISHI HITACHI POWER
SYSTEMS, LTD.
6.12. FUJIAN LONGKING CO., LTD.
6.13. SIEMENS AG
6.14. HERMAX ASIA-PACIFIC
7. METHODOLOGY
& SCOPE
7.1. RESEARCH
SCOPE
7.2. SOURCES
OF DATA
7.3. RESEARCH
METHODOLOGY
TABLE 1: ASIA-PACIFIC AIR POLLUTION CONTROL SYSTEM
MARKET, BY COUNTRY, 2019-2027 (IN $ MILLION)
TABLE 2: MARKET ATTRACTIVENESS INDEX
TABLE 3: VENDOR SCORECARD
TABLE 4: REGULATORY FRAMEWORK
TABLE 5: ASIA-PACIFIC AIR POLLUTION CONTROL SYSTEM
MARKET, BY COUNTRY, 2019-2027 (IN $ MILLION)
TABLE 6: ASIA-PACIFIC AIR POLLUTION CONTROL SYSTEM
MARKET, BY PRODUCTS, 2019-2027 (IN $ MILLION)
TABLE 7: ASIA-PACIFIC AIR POLLUTION CONTROL SYSTEM
MARKET, BY APPLICATION, 2019-2027 (IN $ MILLION)
FIGURE 1: ASIA-PACIFIC AIR POLLUTION CONTROL SYSTEM
MARKET, BY PRODUCTS, 2018 & 2027 (IN %)
FIGURE 2: PORTER’S FIVE FORCE ANALYSIS
FIGURE 3: KEY BUYING IMPACT ANALYSIS
FIGURE 4: INDUSTRY COMPONENTS
FIGURE 5: ASIA-PACIFIC AIR POLLUTION CONTROL SYSTEM
MARKET, BY SCRUBBERS, 2019-2027 (IN $ MILLION)
FIGURE 6: ASIA-PACIFIC AIR POLLUTION CONTROL SYSTEM
MARKET, BY THERMAL OXIDIZERS, 2019-2027 (IN $ MILLION)
FIGURE 7: ASIA-PACIFIC AIR POLLUTION CONTROL SYSTEM
MARKET, BY CATALYTIC CONVERTORS, 2019-2027 (IN $ MILLION)
FIGURE 8: ASIA-PACIFIC AIR POLLUTION CONTROL SYSTEM
MARKET, BY ELECTROSTATIC PRECIPITATORS, 2019-2027 (IN $ MILLION)
FIGURE 9: ASIA-PACIFIC AIR POLLUTION CONTROL SYSTEM
MARKET, BY OTHERS, 2019-2027 (IN $ MILLION)
FIGURE 10: ASIA-PACIFIC AIR POLLUTION CONTROL SYSTEM
MARKET, BY CEMENT, 2019-2027 (IN $ MILLION)
FIGURE 11: ASIA-PACIFIC AIR POLLUTION CONTROL SYSTEM MARKET,
BY IRON & STEEL, 2019-2027 (IN $ MILLION)
FIGURE 12: ASIA-PACIFIC AIR POLLUTION CONTROL SYSTEM
MARKET, BY CHEMICAL, 2019-2027 (IN $ MILLION)
FIGURE 13: ASIA-PACIFIC AIR POLLUTION CONTROL SYSTEM
MARKET, BY POWER GENERATION, 2019-2027 (IN $ MILLION)
FIGURE 14: ASIA-PACIFIC AIR POLLUTION CONTROL SYSTEM
MARKET, BY OTHERS, 2019-2027 (IN $ MILLION)
FIGURE 15: ASIA-PACIFIC AIR POLLUTION CONTROL SYSTEM
MARKET, REGIONAL OUTLOOK, 2018 & 2027 (IN %)
FIGURE 16: CHINA AIR POLLUTION CONTROL SYSTEM MARKET,
2019-2027 (IN $ MILLION)
FIGURE 17: JAPAN AIR POLLUTION CONTROL SYSTEM MARKET,
2019-2027 (IN $ MILLION)
FIGURE 18: INDIA AIR POLLUTION CONTROL SYSTEM MARKET,
2019-2027 (IN $ MILLION)
FIGURE 19: SOUTH KOREA AIR POLLUTION CONTROL SYSTEM
MARKET, 2019-2027 (IN $ MILLION)
FIGURE 20: ASEAN COUNTRIES AIR POLLUTION CONTROL SYSTEM
MARKET, 2019-2027 (IN $ MILLION)
FIGURE 21: AUSTRALIA & NEW ZEALAND AIR POLLUTION
CONTROL SYSTEM MARKET, 2019-2027 (IN $ MILLION)
FIGURE 22: REST OF ASIA-PACIFIC AIR POLLUTION CONTROL
SYSTEM MARKET, 2019-2027 (IN $ MILLION)