

Market By Fuel Type, Power, Application, End-user, And Geography | Forecast 2019-2027
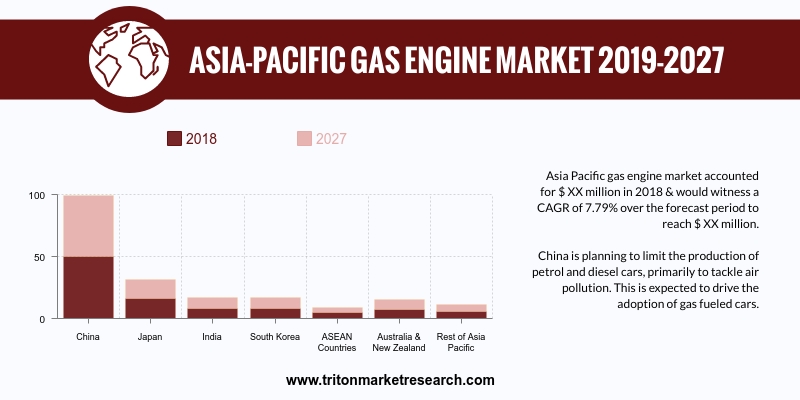
Triton’s research shows the Asia-Pacific market for gas engines to fast progress at a CAGR of 7.79% in terms of revenue during the forecast period 2019-2027.
The countries studied in the Asia-Pacific gas engine market are:
• China
• India
• Japan
• South Korea
• ASEAN countries
• Australia & New Zealand
• Rest of APAC

Report scope can be customized per your requirements. Request For Customization
Japan’s gas engine market is showing robust growth, which can be attributed to the increase in the usage of alternative energy sources. The 2011 earthquake and tsunami that jolted the country resulted in a reduction in the dependence of nuclear energy sources for power generation. This led to a major shift towards alternative sources for electricity generation.
Another reason that favors the gas engine market is the increased focus on the usage of clean and reliable sources of energy. The discontinuance in the usage of nuclear power for electricity generation led to an increase in the fossil fuels being imported, owing to which, there was an upswing in the electricity prices in Japan. This hike in electricity prices led to the wide adoption of energy-efficient technologies (such as gas engines) for power generation.
Moreover, Japan is one of the leading countries in the world, considering power generation using biomass. The government has initiated plans to increase biomass generation in the period between 2015 and 2030. For this purpose, the government has provided 20% incentives for renewable power generation. The Government of Japan intends to transform the country’s transportation sector, classifying it on the basis of the fuel type used. It is estimated there will be around 500,000 gas engine vehicles in the country by the year 2030.
China Yuchai International (CYI) manufactures and produces diesel & natural gas engines for light-duty vehicles, medium-duty vehicles, heavy-duty vehicles & highway vehicles; generator sets; and marine and industrial applications. The Singapore-based company also operates in China and Mauritius. Strategic acquisitions & partnerships with other companies, coupled with the growing market for hybrid-fuel engines, are helping CYI to expand in the forecast period. Taking efforts to expand its business, the company, in July 2018, announced it would be establishing a new subsidiary, ‘Guangxi Yuchai Exhaust Technology Co., Ltd.’
1. ASIA-PACIFIC
GAS ENGINE MARKET – SUMMARY
2. INDUSTRY
OUTLOOK
2.1. MARKET
DEFINITION
2.2. KEY
INSIGHTS
2.2.1. ADVENT
OF DUAL FUEL ENGINES
2.2.2. CONSUMPTION
OF ALTERNATE GASES AS FUELS
2.3. PORTER’S
FIVE FORCES ANALYSIS
2.3.1. THREAT
OF NEW ENTRANTS
2.3.2. THREAT
OF SUBSTITUTE
2.3.3. BARGAINING
POWER OF SUPPLIERS
2.3.4. BARGAINING
POWER OF BUYERS
2.3.5. THREAT
OF COMPETITIVE RIVALRY
2.4. KEY
IMPACT ANALYSIS
2.4.1. COST
2.4.2. EFFICIENCY
2.4.3. EMISSION
2.4.4. MAINTENANCE
2.4.5. FLEXIBILITY
2.5. MARKET
ATTRACTIVENESS INDEX
2.6. VENDOR
SCORECARD
2.7. REGULATORY
FRAMEWORK
2.8. MARKET
DRIVERS
2.8.1. DECREASE
IN GAS PRICES
2.8.2. GROWING
ELECTRICITY DEMAND WORLDWIDE
2.8.3. SURGE
IN ECOLOGICAL CONCERNS
2.8.4. INDUSTRIAL
EXPANSION LEADING TO ENVIRONMENTAL POWER GENERATION
2.9. MARKET
RESTRAINTS
2.9.1. ABNORMALITIES
IN NATURAL GAS RESERVES & PROVISIONS DUE TO REGIONAL INSTABILITY
2.9.2. RISE
IN SAFETY CONCERNS
2.9.3. PRICE
DISPARITY AMONG FUELS
2.10. MARKET
OPPORTUNITIES
2.10.1. EMERGENT INCLINATION TOWARDS
DISTRIBUTED POWER GENERATION
2.10.2. ADVENT OF GAS-FIRED POWER
PLANTS
2.11. MARKET
CHALLENGES
2.11.1. DIMINISHING NATURAL GAS
RESERVES
2.11.2. FIRM REGULATIONS LEVIED BY
AUTHORITIES
3. ASIA-PACIFIC
GAS ENGINE MARKET OUTLOOK - BY FUEL TYPE
3.1. NATURAL
GAS
3.2. SPECIAL
GAS
3.3. OTHER
GAS
4. ASIA-PACIFIC
GAS ENGINE MARKET OUTLOOK – BY POWER
4.1. 0.5
MW-1.0 MW
4.2. 1.0-2.0
MW
4.3. 2.0-5.0
MW
4.4. 5.0
MW-10.0 MW
4.5. 10.0
MW-20.0 MW
5. ASIA-PACIFIC
GAS ENGINE MARKET OUTLOOK – BY APPLICATION
5.1. POWER
GENERATION
5.2. CO-GENERATION
5.3. OTHER
APPLICATIONS
6. ASIA-PACIFIC
GAS ENGINE MARKET OUTLOOK – BY END-USER
6.1. UTILITIES
6.2. MANUFACTURING
6.3. OIL
& GAS
6.4. TRANSPORTATION
6.5. OTHER
END-USERS
7. ASIA-PACIFIC
GAS ENGINE MARKET – REGIONAL OUTLOOK
7.1. CHINA
7.2. JAPAN
7.3. INDIA
7.4. SOUTH
KOREA
7.5. ASEAN
COUNTRIES
7.6. AUSTRALIA
& NEW ZEALAND
7.7. REST
OF ASIA-PACIFIC
8. COMPETITIVE
LANDSCAPE
8.1. 3W-INTERNATIONAL
GMBH
8.2. CATERPILLAR
INC.
8.3. CUMMINS INC.
8.4. CHINA
YUCHAI INTERNATIONAL LTD.
8.5. CLARKE
ENERGY
8.6. DEUTZ
AG
8.7. DRESSER-RAND
GROUP INC.
8.8. DOOSAN
INFRACORE CO. LTD.
8.9. FAIRBANKS
MORSE ENGINE
8.10. GENERAL
ELECTRIC COMPANY (INNIO)
8.11. HYUNDAI
HEAVY INDUSTRIES CO. LTD.
8.12. IHI
CORPORATION
8.13. KAWASAKI
HEAVY INDUSTRIES LTD.
8.14. MAN
SE
8.15. MITSUBISHI
HEAVY INDUSTRIES LTD.
8.16. WÄRTSILÄ
9. METHODOLOGY
& SCOPE
9.1. RESEARCH
SCOPE
9.2. SOURCES
OF DATA
9.3. RESEARCH
METHODOLOGY
TABLE 1: ASIA-PACIFIC
GAS ENGINE MARKET, BY COUNTRY, 2019-2027 (IN $ MILLION)
TABLE 2: VENDOR
SCORECARD
TABLE 3: REGULATORY
FRAMEWORK
TABLE 4: NATURAL GAS
PRICES (DOLLARS PER THOUSAND CUBIC FEET)
TABLE 5: COMPARISON OF
CARBON DIOXIDE EMISSION LEVELS FOR DIFFERENT FUELS (1990-2040) (MILLION METRIC
TONS)
TABLE 6: ASIA-PACIFIC
GAS ENGINE MARKET, BY FUEL TYPE, 2019-2027 (IN $ MILLION)
TABLE 7: ASIA-PACIFIC
GAS ENGINE MARKET, BY POWER, 2019-2027 (IN $ MILLION)
TABLE 8: ASIA-PACIFIC
GAS ENGINE MARKET, BY APPLICATION, 2019-2027 (IN $ MILLION)
TABLE 9: ASIA-PACIFIC
GAS ENGINE MARKET, BY END-USER, 2019-2027 (IN $ MILLION)
TABLE 10: ASIA-PACIFIC
GAS ENGINE MARKET, BY COUNTRY, 2019-2027 (IN $ MILLION)
FIGURE 1: ASIA-PACIFIC
GAS ENGINE MARKET, BY FUEL TYPE, 2018 & 2027 (IN %)
FIGURE 2: PORTER’S FIVE
FORCES ANALYSIS
FIGURE 3: KEY BUYING
IMPACT ANALYSIS
FIGURE 4: MARKET
ATTRACTIVENESS INDEX
FIGURE 5: ASIA-PACIFIC
GAS ENGINE MARKET, BY NATURAL GAS, 2019-2027 (IN $ MILLION)
FIGURE 6: ASIA-PACIFIC
GAS ENGINE MARKET, BY SPECIAL GAS, 2019-2027 (IN $ MILLION)
FIGURE 7: ASIA-PACIFIC
GAS ENGINE MARKET, BY OTHER GAS, 2019-2027 (IN $ MILLION)
FIGURE 8: ASIA-PACIFIC
GAS ENGINE MARKET, BY 0.5 MW-1.0 MW, 2019-2027 (IN $ MILLION)
FIGURE 9: ASIA-PACIFIC
GAS ENGINE MARKET, BY 1.0-2.0 MW, 2019-2027 (IN $ MILLION)
FIGURE 10: ASIA-PACIFIC
GAS ENGINE MARKET, BY 2.0-5.0 MW, 2019-2027 (IN $ MILLION)
FIGURE 11: ASIA-PACIFIC
GAS ENGINE MARKET, BY 5.0 MW-10.0 MW, 2019-2027 (IN $ MILLION)
FIGURE 12: ASIA-PACIFIC
GAS ENGINE MARKET, BY 10.0 MW-20.0 MW, 2019-2027 (IN $ MILLION)
FIGURE 13: ASIA-PACIFIC
GAS ENGINE MARKET, BY POWER GENERATION, 2019-2027 (IN $ MILLION)
FIGURE 14: ASIA-PACIFIC
GAS ENGINE MARKET, BY CO-GENERATION, 2019-2027 (IN $ MILLION)
FIGURE 15: ASIA-PACIFIC
GAS ENGINE MARKET, BY OTHER APPLICATIONS 2019-2027 (IN $ MILLION)
FIGURE 16: ASIA-PACIFIC
GAS ENGINE MARKET, BY UTILITIES, 2019-2027 (IN $ MILLION)
FIGURE 17: ASIA-PACIFIC
GAS ENGINE MARKET, BY MANUFACTURING, 2019-2027 (IN $ MILLION)
FIGURE 18: ASIA-PACIFIC
GAS ENGINE MARKET, BY OIL & GAS, 2019-2027 (IN $ MILLION)
FIGURE 19: ASIA-PACIFIC
GAS ENGINE MARKET, BY TRANSPORTATION, 2019-2027 (IN $ MILLION)
FIGURE 20: ASIA-PACIFIC
GAS ENGINE MARKET, BY OTHER END-USERS, 2019-2027 (IN $ MILLION)
FIGURE 21: ASIA-PACIFIC
GAS ENGINE MARKET, REGIONAL OUTLOOK, 2018 & 2027 (IN %)
FIGURE 22: CHINA GAS
ENGINE MARKET, 2019-2027 (IN $ MILLION)
FIGURE 23: JAPAN GAS
ENGINE MARKET, 2019-2027 (IN $ MILLION)
FIGURE 24: INDIA GAS
ENGINE MARKET, 2019-2027 (IN $ MILLION)
FIGURE 25: SOUTH KOREA
GAS ENGINE MARKET, 2019-2027 (IN $ MILLION)
FIGURE 26: ASEAN
COUNTRIES GAS ENGINE MARKET, 2019-2027 (IN $ MILLION)
FIGURE 27: AUSTRALIA
& NEW ZEALAND GAS ENGINE MARKET, 2019-2027 (IN $ MILLION)
FIGURE 28: REST OF
ASIA-PACIFIC GAS ENGINE MARKET, 2019-2027 (IN $ MILLION)