

Market By Technology, Application, Product, And Region | Forecast 2019-2027
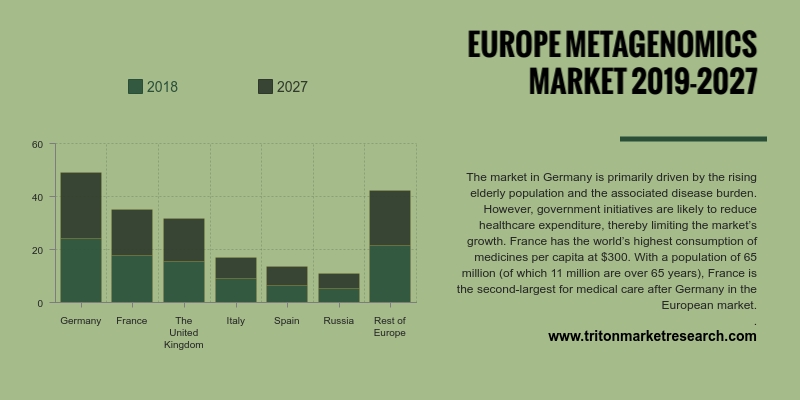
Triton’s research on the European metagenomics market depicts the industry to grow substantially in terms of revenue, at a CAGR of 15.78% during the forecast period 2019-2027.
The countries analyzed in Europe’s metagenomics market are:
• Russia
• Spain
• Italy
• Germany
• France
• The United Kingdom
• Rest of Europe

The Europe metagenomics market is being driven by the rising prevalence of chronic diseases, an increase in the number of diagnostic centers, growing healthcare spending, the surge in cardiovascular diseases, and advancements in technology. The Germany market is steadily gaining momentum and is slated to become the hub of innovative medicines in the future, providing a strong infrastructural support to both domestic as well as international players to establish and expand their base. The stable fiscal environment in the country is characterized by low corporate taxes, interest rates, and structural debt, which support its sustained economic growth. Germany’s transparent regulatory system encourages foreign companies to invest in this market. These factors are expected to fuel the German metagenomics market growth.
Italy is among the top five destinations in Europe for research & development purposes, having an overall attractiveness of 32%, states the European Commission. In 2015, the Government of Italy invested 1.68% of its total GDP for R&D and is planning to invest further in the coming future. The major proportion of research & development activity in the country is carried out at university levels. The life sciences industries, such as Biotech and CROs, and pharma companies have been collaborating with regional institutions for research purposes, thereby, enhancing the growth of the metagenomics market in Italy.
Qiagen N.V. provides sample and assay technologies for applied testing, molecular diagnostics and pharmaceutical and academic research. The company boasts of a product portfolio consisting of more than 500 products and has over 2,000 patents and licenses. Qiagen provides numerous kits and accessories for the process of cfDNA testing, and has also launched a number of products to assist in liquid biopsy. The company has its headquarters in Hilden, Germany. Qiagen has consolidated its position in the industry by acquiring companies like MO BIO Laboratories Inc., Exiqon A/S, and OmicSoft Corporation.
1. EUROPE
METAGENOMICS MARKET - SUMMARY
2. INDUSTRY
OUTLOOK
2.1. MARKET
DEFINITION
2.2. PORTER’S
FIVE FORCES MODEL
2.2.1. THREAT
OF NEW ENTRANTS
2.2.2. THREAT
OF SUBSTITUTE
2.2.3. BARGAINING
POWER OF SUPPLIERS
2.2.4. BARGAINING
POWER OF BUYERS
2.2.5. THREAT
OF COMPETITIVE RIVALRY
2.3. MARKET
ATTRACTIVENESS INDEX
2.4. MARKET
PLAYER POSITIONING
2.5. KEY
INSIGHT
2.6. MARKET
DRIVERS
2.6.1. GROWING
AWARENESS AND DEVELOPMENT IN PLATFORMS AND SEQUENCING DEVICES
2.6.2. INCREASE
IN COLLABORATION BETWEEN METAGENOMIC EXPERIMENTS AND COMPUTING TECHNOLOGIES
2.6.3. EXPANSION
OF METAGENOMICS APPLICATIONS
2.7. MARKET
RESTRAINTS
2.7.1. STRINGENT
REGULATORY FRAMEWORK
2.7.2. UNAVAILABILITY
OF SKILLED PROFESSIONALS
2.8. MARKET
OPPORTUNITIES
2.8.1. INCREASING
GOVERNMENT INITIATIVES IN THE DEVELOPING ECONOMIES
2.8.2. DEVELOPMENTS
IN NEXT-GENERATION SEQUENCING (NGS) PROCESS
2.9. MARKET
CHALLENGES
2.9.1. CHALLENGES
ASSOCIATED WITH DNA SEQUENCING PROCESS OR TECHNIQUES
2.9.2. BIOINFORMATICS
LIMITATION IN DNA SEQUENCING
3. METAGENOMICS
MARKET OUTLOOK- BY TECHNOLOGY
3.1. SEQUENCING
3.2. BIOINFORMATICS
4. METAGENOMICS
MARKET OUTLOOK- BY APPLICATION
4.1. GUT
MICROBE CHARACTERIZATION
4.2. INFECTIOUS
DISEASE DIAGNOSIS
4.3. BIOTECHNOLOGY
4.4. ENVIRONMENTAL
REMEDIATION
4.5. BIOFUEL
4.6. AGRICULTURE
5. METAGENOMICS
MARKET OUTLOOK- BY PRODUCT
5.1. CONSUMABLES
5.2. INSTRUMENTS
5.3. SOFTWARE
6. METAGENOMICS
MARKET - REGIONAL OUTLOOK
6.1. EUROPE
6.1.1. COUNTRY
ANALYSIS
6.1.1.1. GERMANY
6.1.1.2. FRANCE
6.1.1.3. THE
UNITED KINGDOM
6.1.1.4. ITALY
6.1.1.5. SPAIN
6.1.1.6. RUSSIA
6.1.1.7. REST
OF EUROPE
7. COMPANY
PROFILES
7.1. BIO-RAD
LABORATORIES, INC.
7.2. QIAGEN
N.V.
7.3. ENTEROME
SA
7.4. SWIFT
BIOSCIENCES INC.
7.5. F.
HOFFMANN-LA ROCHE LTD
7.6. AGILENT
TECHNOLOGIES, INC.
7.7. THERMO
FISHER SCIENTIFIC INC.
7.8. ILLUMINA,
INC.
7.9. PERKINELMER,
INC.
7.10. INTEGRAGEN
S.A
7.11. OXFORD
NANOPORE TECHNOLOGIES LTD.
7.12. PACIFIC
BIOSCIENCES OF CALIFORNIA, INC.
7.13. TAKARA
BIO, INC.
7.14. GENOSCREEN
7.15. NOVOGENE
CO., LTD.
8. RESEARCH
METHODOLOGY & SCOPE
8.1. RESEARCH
SCOPE & DELIVERABLES
8.1.1. OBJECTIVES
OF STUDY
8.1.2. SCOPE
OF STUDY
8.2. SOURCES
OF DATA
8.2.1. PRIMARY
DATA SOURCES
8.2.2. SECONDARY
DATA SOURCES
8.3. RESEARCH
METHODOLOGY
8.3.1. EVALUATION
OF PROPOSED MARKET
8.3.2. IDENTIFICATION
OF DATA SOURCES
8.3.3. ASSESSMENT
OF MARKET DETERMINANTS
8.3.4. DATA
COLLECTION
8.3.5. DATA
VALIDATION & ANALYSIS
TABLE 1 EUROPE METAGENOMICS MARKET 2019-2027 ($
MILLION)
TABLE 2 COMPANY’S MARKET POSITION OUTLOOK IN
2017 (%)
TABLE 3 EUROPE METAGENOMICS MARKET BY TECHNOLOGY
2019-2027 ($ MILLION)
TABLE 4 EUROPE METAGENOMICS MARKET BY
APPLICATION 2019-2027 ($ MILLION)
TABLE 5 EUROPE METAGENOMICS MARKET BY PRODUCTS
2019-2027 ($ MILLION)
TABLE 6 EUROPE METAGENOMICS MARKET BY COUNTRY
2019-2027 ($ MILLION)
FIGURE 1 EUROPE METAGENOMICS MARKET 2019-2027 ($
MILLION)
FIGURE 2 EUROPE METAGENOMICS MARKET BY SEQUENCING
2019-2027 ($ MILLION)
FIGURE 3 EUROPE METAGENOMICS MARKET BY
BIOINFORMATICS 2019-2027 ($ MILLION)
FIGURE 4 EUROPE METAGENOMICS MARKET BY GUT MICROBE
CHARACTERIZATION 2019-2027 ($ MILLION)
FIGURE 5 EUROPE METAGENOMICS MARKET BY INFECTIOUS
DISEASE DIAGNOSIS 2019-2027 ($ MILLION)
FIGURE 6 EUROPE METAGENOMICS MARKET BY
BIOTECHNOLOGY 2019-2027 ($ MILLION)
FIGURE 7 EUROPE METAGENOMICS MARKET BY ENVIRONMENTAL
REMEDIATION 2019-2027 ($ MILLION)
FIGURE 8 EUROPE METAGENOMICS MARKET BY BIOFUEL
2019-2027 ($ MILLION)
FIGURE 9 EUROPE METAGENOMICS MARKET BY AGRICULTURE
2019-2027 ($ MILLION)
FIGURE 10 EUROPE METAGENOMICS MARKET BY CONSUMABLES
2019-2027 ($ MILLION)
FIGURE 11 EUROPE METAGENOMICS MARKET BY INSTRUMENTS
2019-2027 ($ MILLION)
FIGURE 12 EUROPE METAGENOMICS MARKET BY SOFTWARE
2019-2027 ($ MILLION)
FIGURE 13 GERMANY METAGENOMICS MARKET 2019-2027 ($
MILLION)
FIGURE 14 FRANCE METAGENOMICS MARKET 2019-2027 ($
MILLION)
FIGURE 15 THE UNITED KINGDOM METAGENOMICS MARKET
2019-2027 ($ MILLION)
FIGURE 16 ITALY METAGENOMICS MARKET 2019-2027 ($
MILLION)
FIGURE 17 SPAIN METAGENOMICS MARKET 2019-2027 ($
MILLION)
FIGURE 18 RUSSIA METAGENOMICS MARKET 2019-2027 ($ MILLION)
FIGURE 19 REST OF EUROPE METAGENOMICS MARKET 2019-2027
($ MILLION)