

Market By Food Type And Geography | Forecast 2019-2027
After a detailed analysis, Triton Market Research has constitutively analyzed that the genetically modified foods market is projected to display an upward trend in terms of revenue and is estimated to grow at a CAGR of 5.85% during the forecasting years of 2019-2027. The market was assessed to be worth $22716.84 million in the year 2018 and is predicted to generate a revenue of approximately $37450.77 million by the year 2027. Genetically modified food is generated from the altered DNA of animals and plants through genetic engineering techniques and the organisms utilized in the process are termed as GMO.
Genetic engineering consists of procedures for direct manipulation of the genomics of an organism. There are several techniques for modifying the genes of an entity; for instance, transforming the DNA of other organisms. This is not similar to the traditional process, which involved selecting specific breeding plants and animals to achieve the required qualities. In the US, genetically modified foods are being manufactured and utilized sine 1994. One of the prominent examples is the introduction of "Flavr Savr" tomatoes that are engineered to grow slower than their required time.

Report scope can be customized per your requirements. Request For Customization
Genetic engineering can be equipped for several purposes. Presently, by using this technique, a large variety of soy and corn are developed in the United States to achieve resistance from herbicides. This eases the task of spraying the field with weed killers. Some other kinds of crops are modified to resist pests. Genetic engineering conceivably helps to create crops that can endure drought or help in producing vegetables, fruits, etc., that are more nutritious, healthy and beneficial.
Scientific evidence has proven that genetically modified foods have no health risk than other normal foods. However, GM foods have been into controversy. Some debate that genetically modified crops depend on the growing usage of herbicides that have a disturbing quantity of chemical or reference problems as GMOs are patented and owned by big companies, which has resulted in arguing over GMOs being labeled or strictly regulated.
In spite of all the criticisms and hindrances, the demand for the GMO foods market is rising in recent years due to its nutritional value. But, the GMO foods market is in its early stage and has a long way to penetrate further into every shelf of the market. Since the demand for GMO foods is rising continuously, stacked traits which is a mix of more than one transgene is expected to see the highest increase when compared to insect resistance (IR) and herbicide tolerance (HT).
The genetically modified foods market report from Triton has discussed the market definition and key insights regarding the industry as well as the evolution and transition of genetically modified foods. Also, industry components, regulatory framework, market opportunity insights, market attractiveness matrix, vendor scorecard, Porter's five force analysis, key impact analysis, industrial player positioning and key market strategies have been studied.
The key market drivers such as the surging demand for healthy food, high demand for crop yield, increase in the genetically modified crop plantations and the reduction in the use of pesticides have been analyzed further in the report. The industry is facing stiff market restraints like the negative impact on soil fertility and stringent government regulations which are obstructing the growth of the market globally.
Key opportunities like the increasing investments in biotechnology research & development, growing adoption of genetically modified foods in developing geographies, rise in the production of GM foods and the technological developments can be leveraged by the industry to boost the growth over the projected period. However, despite the multiple growth avenues, the lack of public awareness is one of the key challenges obstructing the market growth.

To get detailed insights on segments, Download Sample Report
Geographies covered in the genetically modified foods market are:
• North America: the United States and Canada
• Europe: Regional Analysis
• Asia-Pacific: China, Philippines, India, Australia, Pakistan and rest of Asia-Pacific
• Latin America: Brazil, Argentina, Paraguay, Uruguay, Bolivia and rest of Latin America
• Africa: South Africa and rest of Africa
The genetically modified foods market, in this report, has been segmented into:
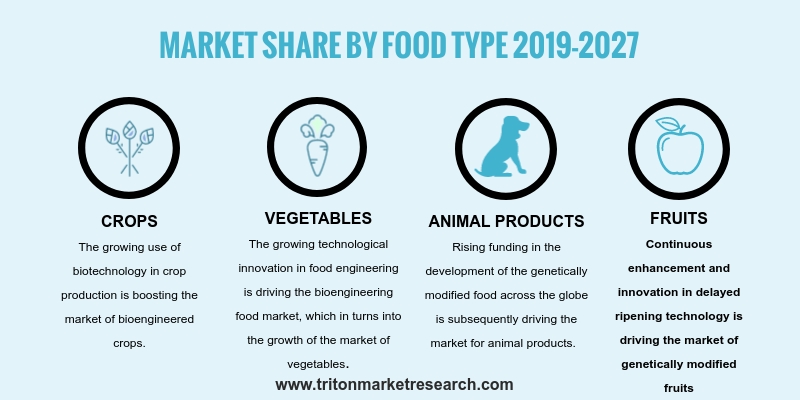
• By food type:
o Crops
• Corn
• Soybean
• Canola
• Sugar beet
• Cotton
• Other crops
o Vegetables
o Fruits
o Animal products
The key players in the genetically modified foods market are Takii & Co., Ltd., Okanagan Specialty Fruits, Inc. (OSF), DLF-Trifolium, KWS SAAT SE, Dow-DuPont, BASF SE, Syngenta, Bayer AG, Stine Seed, Group Limagrain, J.R. Simplot, Monsanto Company, Metahelix Life Sciences Limited, AquaBounty Technologies, Inc. and WinField Solutions, LLC.
The strategic analysis for each of these companies in the genetically modified foods market has been covered in detail. The company market share helps to dive into the information about the key market players in this industry and their hold on the market.
1. GENETICALLY
MODIFIED FOODS MARKET - SUMMARY
2. INDUSTRY
OUTLOOK
2.1. MARKET
DEFINITION
2.2. KEY
INSIGHTS
2.3. EVOLUTION
& TRANSITION OF GENETICALLY MODIFIED FOODS
2.4. PORTER’S
FIVE FORCE ANALYSIS
2.5. MARKET
ATTRACTIVENESS MATRIX
2.6. INDUSTRY
COMPONENTS
2.7. REGULATORY
FRAMEWORK
2.8. VENDOR
SCORECARD
2.9. KEY
IMPACT ANALYSIS
2.10.
MARKET OPPORTUNITY INSIGHTS
2.11.
INDUSTRY PLAYER POSITIONING
2.12.
KEY MARKET STRATEGIES
2.13.
MARKET DRIVERS
2.13.1.
SURGE IN THE DEMAND OF HEALTHY
FOOD
2.13.2.
HIGH DEMAND FOR CROP YIELD
2.13.3.
INCREASE IN GENETICALLY
MODIFIED CROPS PLANTATION
2.13.4.
REDUCTION IN THE USAGE OF
PESTICIDES
2.14.
MARKET RESTRAINTS
2.14.1.
NEGATIVE IMPACT ON SOIL
FERTILITY
2.14.2.
STRINGENT GOVERNMENT
REGULATIONS
2.15.
MARKET OPPORTUNITIES
2.15.1.
INCREASING INVESTMENTS IN BIOTECHNOLOGY RESEARCH & DEVELOPMENT
2.15.2.
GROWING ADOPTION OF
GENETICALLY MODIFIED FOODS IN DEVELOPING REGIONS
2.15.3.
RISE IN THE PRODUCTION OF GM
FOODS
2.15.4.
TECHNOLOGICAL DEVELOPMENTS IN
THE FIELD OF GM FOODS
2.16.
MARKET CHALLENGES
2.16.1.
LACK OF PUBLIC AWARENESS
3. GENETICALLY
MODIFIED FOODS MARKET OUTLOOK - BY FOOD TYPE
3.1. CROPS
3.1.1. CORN
3.1.2. SOYBEAN
3.1.3. CANOLA
3.1.4. SUGAR
BEET
3.1.5. COTTON
3.1.6. OTHER
CROPS
3.2. VEGETABLES
3.3. FRUITS
3.4. ANIMAL
PRODUCTS
4. GENETICALLY
MODIFIED FOODS MARKET - REGIONAL OUTLOOK
4.1. NORTH
AMERICA
4.1.1. MARKET
BY FOOD TYPE
4.1.2. MARKET
BY CROP TYPE
4.1.3. COUNTRY
ANALYSIS
4.1.3.1. UNITED
STATES
4.1.3.2. CANADA
4.2. EUROPE
4.2.1. MARKET
BY FOOD TYPE
4.2.2. MARKET
BY CROP TYPE
4.2.3. REGIONAL
ANALYSIS
4.3. ASIA-PACIFIC
4.3.1. MARKET
BY FOOD TYPE
4.3.2. MARKET
BY CROP TYPE
4.3.3. COUNTRY
ANALYSIS
4.3.3.1. CHINA
4.3.3.2. INDIA
4.3.3.3. PHILIPPINES
4.3.3.4. PAKISTAN
4.3.3.5. AUSTRALIA
4.3.3.6. REST
OF ASIA-PACIFIC
4.4. LATIN
AMERICA
4.4.1. MARKET
BY FOOD TYPE
4.4.2. MARKET
BY CROP TYPE
4.4.3. COUNTRY
ANALYSIS
4.4.3.1. BRAZIL
4.4.3.2. ARGENTINA
4.4.3.3. PARAGUAY
4.4.3.4. URUGUAY
4.4.3.5. BOLIVIA
4.4.3.6. REST
OF LATIN AMERICA
4.5. AFRICA
4.5.1. MARKET
BY FOOD TYPE
4.5.2. MARKET
BY CROP TYPE
4.5.3. COUNTRY
ANALYSIS
4.5.3.1. SOUTH
AFRICA
4.5.3.2. REST
OF AFRICA
5. COMPETITIVE
LANDSCAPE
5.1. DLF-TRIFOLIUM
5.2. GROUP
LIMAGRAIN
5.3. BASF
SE
5.4. BAYER
AG
5.5. DOW-DUPONT
5.6. KWS
SAAT SE
5.7. MONSANTO
COMPANY
5.8. WINFIELD SOLUTIONS, LLC.
5.9. OKANAGAN
SPECIALTY FRUITS, INC. (OSF)
5.10.
METAHELIX LIFE SCIENCES
LIMITED
5.11.
STINE SEED
5.12.
AQUABOUNTY TECHNOLOGIES, INC.
5.13.
J.R. SIMPLOT
5.14.
SYNGENTA
5.15.
TAKII & CO., LTD.
6. METHODOLOGY
& SCOPE
6.1. RESEARCH
SCOPE
6.2. SOURCES
OF DATA
6.3. RESEARCH
METHODOLOGY
TABLE 1. MARKET
ATTRACTIVENESS MATRIX FOR GENETICALLY MODIFIED FOODS MARKET
TABLE 2. VENDOR
SCORECARD OF GENETICALLY MODIFIED FOODS MARKET
TABLE 3. REGULATORY
FRAMEWORK OF GENETICALLY MODIFIED FOODS MARKET
TABLE 4. KEY STRATEGIC
DEVELOPMENTS IN GENETICALLY MODIFIED FOODS MARKET
TABLE 5. APPROVALS FOR
GENETICALLY MODIFIED FOOD, FEED & CULTIVATION, BY COUNTRY, 2016
TABLE 6. WORLDWIDE AREA
UNDER GENETICALLY MODIFIED CROPS 1996-2016 (IN MILLION ACRES)
TABLE 7. COUNTRY-WISE
AREA UNDER GENETICALLY MODIFIED CROPS, 2015 & 2016 (IN MILLION HECTARES)
TABLE 8. IMPACT OF
BIOENGINEERED CROPS ON THE USE OF HERBICIDES AND INSECTICIDES
TABLE 9. EXAMPLES OF
GENETICALLY MODIFIED FOODS
TABLE 10. GLOBAL
GENETICALLY MODIFIED FOODS MARKET, BY FOOD TYPE, 2019-2027 (IN $ MILLION)
TABLE 11. GLOBAL
GENETICALLY MODIFIED CROPS MARKET, BY CROP TYPE, 2019-2027 (IN $ MILLION)
TABLE 12. GLOBAL
GENETICALLY MODIFIED FOODS MARKET, REGIONAL OUTLOOK, 2019-2027 (IN $ MILLION)
TABLE 13. NORTH AMERICA
GENETICALLY MODIFIED FOODS MARKET, COUNTRY OUTLOOK, 2019-2027 (IN $ MILLION)
TABLE 14. NORTH AMERICA
GENETICALLY MODIFIED FOODS MARKET, BY FOOD TYPE, 2019-2027 (IN $ MILLION)
TABLE 15. NORTH AMERICA
GENETICALLY MODIFIED CROPS MARKET, BY CROP TYPE, 2019-2027 (IN $ MILLION)
TABLE 16. EUROPE
GENETICALLY MODIFIED FOODS MARKET, BY FOOD TYPE, 2019-2027 (IN $ MILLION)
TABLE 17. EUROPE
GENETICALLY MODIFIED CROPS MARKET, BY CROP TYPE, 2019-2027 (IN $ MILLION)
TABLE 18. ASIA-PACIFIC
GENETICALLY MODIFIED FOODS MARKET, COUNTRY OUTLOOK, 2019-2027 (IN $ MILLION)
TABLE 19. ASIA-PACIFIC
GENETICALLY MODIFIED FOODS MARKET, BY FOOD TYPE, 2019-2027 (IN $ MILLION)
TABLE 20. ASIA-PACIFIC
GENETICALLY MODIFIED CROPS MARKET, BY CROP TYPE, 2019-2027 (IN $ MILLION)
TABLE 21. LATIN AMERICA
GENETICALLY MODIFIED FOODS MARKET, COUNTRY OUTLOOK, 2019-2027 (IN $ MILLION)
TABLE 22. LATIN AMERICA
GENETICALLY MODIFIED FOODS MARKET, BY FOOD TYPE, 2019-2027 (IN $ MILLION)
TABLE 23. LATIN AMERICA
GENETICALLY MODIFIED CROPS MARKET, BY CROP TYPE, 2019-2027 (IN $ MILLION)
TABLE 24. AFRICA
GENETICALLY MODIFIED FOODS MARKET, COUNTRY OUTLOOK, 2019-2027 (IN $ MILLION)
TABLE 25. AFRICA GENETICALLY
MODIFIED FOODS MARKET, BY FOOD TYPE, 2019-2027 (IN $ MILLION)
TABLE 26. AFRICA
GENETICALLY MODIFIED CROPS MARKET, BY CROP TYPE, 2019-2027 (IN $ MILLION)
FIGURE 1. GLOBAL
GENETICALLY MODIFIED FOODS MARKET, 2019-2027 (IN $ MILLION)
FIGURE 2. PORTER’S FIVE
FORCE ANALYSIS OF GENETICALLY MODIFIED FOODS MARKET
FIGURE 3. KEY IMPACT
ANALYSIS
FIGURE 4. TIMELINE OF
GENETICALLY MODIFIED FOODS
FIGURE 5. MARKET
OPPORTUNITY INSIGHTS, BY REGION, 2018
FIGURE 6. MARKET
OPPORTUNITY INSIGHTS, BY FOOD TYPE, 2018
FIGURE 7. INDUSTRY
COMPONENTS OF GENETICALLY MODIFIED FOODS MARKET
FIGURE 8. KEY PLAYER
POSITIONING IN 2018 (%)
FIGURE 9. NUMBER OF
UNDERNOURISHED POPULACE WORLDWIDE, 2010-2016 (IN MILLIONS)
FIGURE 10. AREA UNDER
MOST PLANTED GENETICALLY MODIFIED CROPS VERSUS CONVENTIONAL CROPS IN 2016 (IN
MILLION HECTARES)
FIGURE 11. GLOBAL
GENETICALLY MODIFIED FOODS MARKET, BY CROPS, 2019-2027 (IN $ MILLION)
FIGURE 12. GLOBAL
GENETICALLY MODIFIED CROPS MARKET, BY CORN, 2019-2027 (IN $ MILLION)
FIGURE 13. GLOBAL
GENETICALLY MODIFIED CROPS MARKET, BY SOYBEAN, 2019-2027 (IN $ MILLION)
FIGURE 14. GLOBAL
GENETICALLY MODIFIED CROPS MARKET, BY CANOLA, 2019-2027 (IN $ MILLION)
FIGURE 15. GLOBAL
GENETICALLY MODIFIED CROPS MARKET, BY SUGAR BEET, 2019-2027 (IN $ MILLION)
FIGURE 16. GLOBAL
GENETICALLY MODIFIED CROPS MARKET, BY COTTON, 2019-2027 (IN $ MILLION)
FIGURE 17. GLOBAL
GENETICALLY MODIFIED CROPS MARKET, BY OTHER CROPS, 2019-2027 (IN $ MILLION)
FIGURE 18. GLOBAL
GENETICALLY MODIFIED FOODS MARKET, BY VEGETABLES, 2019-2027 (IN $ MILLION)
FIGURE 19. GLOBAL
GENETICALLY MODIFIED FOODS MARKET, BY FRUITS, 2019-2027 (IN $ MILLION)
FIGURE 20. GLOBAL
GENETICALLY MODIFIED FOODS MARKET, BY ANIMAL PRODUCTS, 2019-2027 (IN $ MILLION)
FIGURE 21. GLOBAL
GENETICALLY MODIFIED FOODS MARKET, REGIONAL OUTLOOK, 2018 & 2027 (IN %)
FIGURE 22. UNITED
STATES GENETICALLY MODIFIED FOODS MARKET, 2019-2027 (IN $ MILLION)
FIGURE 23. CANADA
GENETICALLY MODIFIED FOODS MARKET, 2019-2027 (IN $ MILLION)
FIGURE 24. CHINA
GENETICALLY MODIFIED FOODS MARKET, 2019-2027 (IN $ MILLION)
FIGURE 25. INDIA
GENETICALLY MODIFIED FOODS MARKET, 2019-2027 (IN $ MILLION)
FIGURE 26. PHILIPPINES
GENETICALLY MODIFIED FOODS MARKET, 2019-2027 (IN $ MILLION)
FIGURE 27. PAKISTAN
GENETICALLY MODIFIED FOODS MARKET, 2019-2027 (IN $ MILLION)
FIGURE 28. AUSTRALIA
GENETICALLY MODIFIED FOODS MARKET, 2019-2027 (IN $ MILLION)
FIGURE 29. REST OF
ASIA-PACIFIC GENETICALLY MODIFIED FOODS MARKET, 2019-2027 (IN $ MILLION)
FIGURE 30. BRAZIL
GENETICALLY MODIFIED FOODS MARKET, 2019-2027 (IN $ MILLION)
FIGURE 31. ARGENTINA
GENETICALLY MODIFIED FOODS MARKET, 2019-2027 (IN $ MILLION)
FIGURE 32. PARAGUAY
GENETICALLY MODIFIED FOODS MARKET, 2019-2027 (IN $ MILLION)
FIGURE 33. URUGUAY
GENETICALLY MODIFIED FOODS MARKET, 2019-2027 (IN $ MILLION)
FIGURE 34. BOLIVIA
GENETICALLY MODIFIED FOODS MARKET, 2019-2027 (IN $ MILLION)
FIGURE 35. REST OF
LATIN AMERICA GENETICALLY MODIFIED FOODS MARKET, 2019-2027 (IN $ MILLION)
FIGURE 36. SOUTH AFRICA
GENETICALLY MODIFIED FOODS MARKET, 2019-2027 (IN $ MILLION)
FIGURE 37. REST OF
AFRICA GENETICALLY MODIFIED FOODS MARKET, 2019-2027 (IN $ MILLION)