

Market By Technology, Application, Product, And Region | Forecast 2019-2027
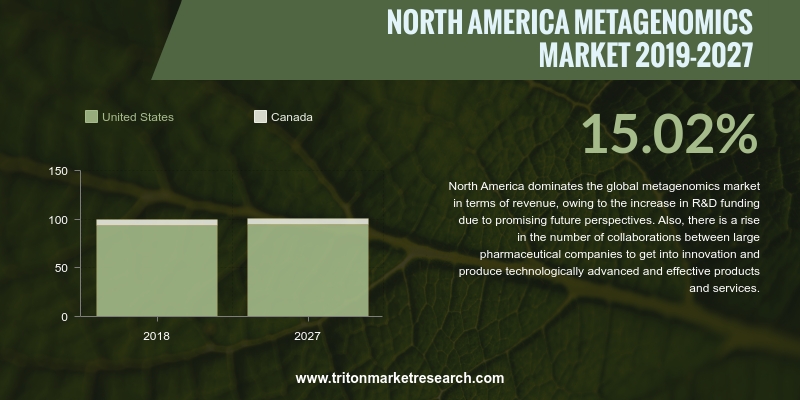
The results of a study conducted by Triton Market Research show that the North America market for metagenomics will grow positively in terms of revenue, at a CAGR of 15.02% for the forecast period of 2019-2027.
The countries scrutinized in the North America metagenomics market are:
• The United States
• Canada

North America is the most dominant region in the global metagenomics market in revenue terms, which is attributable to the increase in R&D funding as the region shows promising future perspectives. Also, large pharmaceutical companies are increasingly collaborating among themselves, to innovate and produce hi-tech and effective products and services. The overall rise in demand for metagenomics drugs as well as diagnostic techniques is a result of the rise in occurrences of cancer, neurodegenerative diseases and cardiovascular diseases. Government funding to carry out epigenetics research, advanced healthcare facilities, continuous increase in the geriatric population, advanced technology, diligent research, accurate diagnostic procedures, and successful initiatives are the most prominent drivers of the market.
Canada is known for its strong pharmaceutical industry and is one of the most preferred locations for conducting clinical trials. International players and biotech firms have been increasingly investing in academic-industrial translational activities in the country in recent years, and many of the major pharma firms too conduct several of their clinical trials in the country. The strong infrastructure for R&D and clinical trials, as well as Canada’s rising elderly populace, are driving the growth of the metagenomics market.
Agilent Technologies, Inc. offers reagents, consumables, and instruments to the applied chemical, diagnostics, and life sciences markets. The company offers its products to food; environmental; forensics; chemical & energy; CRO & CMO; and pharma and biotech industries. Established in 1999, the North America-based company has its headquarters in Santa Clara, California. In August 2019, Agilent acquired BioTek Instruments. In the same month, it partnered with NUH and NUS to launch a new translational research and development hub to help boost clinical diagnostics.
1. NORTH
AMERICA METAGENOMICS MARKET – SUMMARY
2. INDUSTRY
OUTLOOK
2.1. MARKET
DEFINITION
2.2. PORTER’S
FIVE FORCES MODEL
2.2.1. THREAT
OF NEW ENTRANTS
2.2.2. THREAT
OF SUBSTITUTE
2.2.3. BARGAINING
POWER OF SUPPLIERS
2.2.4. BARGAINING
POWER OF BUYERS
2.2.5. THREAT
OF COMPETITIVE RIVALRY
2.3. MARKET
ATTRACTIVENESS INDEX
2.4. MARKET
PLAYER POSITIONING
2.5. KEY
INSIGHT
2.6. MARKET
DRIVERS
2.6.1. GROWING
AWARENESS AND DEVELOPMENT IN PLATFORMS AND SEQUENCING DEVICES
2.6.2. INCREASE
IN COLLABORATION BETWEEN METAGENOMIC EXPERIMENTS AND COMPUTING TECHNOLOGIES
2.6.3. EXPANSION
OF METAGENOMICS APPLICATIONS
2.7. MARKET
RESTRAINTS
2.7.1. STRINGENT
REGULATORY FRAMEWORK
2.7.2. UNAVAILABILITY
OF SKILLED PROFESSIONALS
2.8. MARKET
OPPORTUNITIES
2.8.1. INCREASING
GOVERNMENT INITIATIVES IN THE DEVELOPING ECONOMIES
2.8.2. DEVELOPMENTS
IN NEXT-GENERATION SEQUENCING (NGS) PROCESS
2.9. MARKET
CHALLENGES
2.9.1. CHALLENGES
ASSOCIATED WITH DNA SEQUENCING PROCESS OR TECHNIQUES
2.9.2. BIOINFORMATICS
LIMITATION IN DNA SEQUENCING
3. METAGENOMICS
MARKET OUTLOOK – BY TECHNOLOGY
3.1. SEQUENCING
3.2. BIOINFORMATICS
4. METAGENOMICS
MARKET OUTLOOK – BY APPLICATION
4.1. GUT
MICROBE CHARACTERIZATION
4.2. INFECTIOUS
DISEASE DIAGNOSIS
4.3. BIOTECHNOLOGY
4.4. ENVIRONMENTAL
REMEDIATION
4.5. BIOFUEL
4.6. AGRICULTURE
5. METAGENOMICS
MARKET OUTLOOK – BY PRODUCT
5.1. CONSUMABLES
5.2. INSTRUMENTS
5.3. SOFTWARE
6. METAGENOMICS
MARKET – REGIONAL OUTLOOK
6.1. NORTH
AMERICA
6.1.1. COUNTRY
ANALYSIS
6.1.1.1. THE
UNITED STATES
6.1.1.2. CANADA
7. COMPANY
PROFILES
7.1. BIO-RAD
LABORATORIES, INC.
7.2. QIAGEN
N.V.
7.3. ENTEROME
SA
7.4. SWIFT
BIOSCIENCES INC.
7.5. F.
HOFFMANN-LA ROCHE LTD.
7.6. AGILENT
TECHNOLOGIES, INC.
7.7. THERMO
FISHER SCIENTIFIC, INC.
7.8. ILLUMINA,
INC.
7.9. PERKINELMER,
INC.
7.10. INTEGRAGEN
S.A
7.11. OXFORD
NANOPORE TECHNOLOGIES LTD.
7.12. PACIFIC
BIOSCIENCES OF CALIFORNIA, INC.
7.13. TAKARA
BIO, INC.
7.14. GENOSCREEN
7.15. NOVOGENE
CO., LTD.
8. RESEARCH
METHODOLOGY & SCOPE
8.1. RESEARCH
SCOPE & DELIVERABLES
8.1.1. OBJECTIVES
OF STUDY
8.1.2. SCOPE
OF STUDY
8.2. SOURCES
OF DATA
8.2.1. PRIMARY
DATA SOURCES
8.2.2. SECONDARY
DATA SOURCES
8.3. RESEARCH
METHODOLOGY
8.3.1. EVALUATION
OF PROPOSED MARKET
8.3.2. IDENTIFICATION
OF DATA SOURCES
8.3.3. ASSESSMENT
OF MARKET DETERMINANTS
8.3.4. DATA
COLLECTION
8.3.5. DATA
VALIDATION & ANALYSIS
TABLE 1 NORTH AMERICA METAGENOMICS MARKET
2019-2027 ($ MILLION)
TABLE 2 COMPANIES MARKET POSITION OUTLOOK IN
2017 (%)
TABLE 3 NORTH AMERICA METAGENOMICS MARKET BY
TECHNOLOGY 2019-2027 ($ MILLION)
TABLE 4 NORTH AMERICA METAGENOMICS MARKET BY
APPLICATION 2019-2027 ($ MILLION)
TABLE 5 NORTH AMERICA METAGENOMICS MARKET BY
PRODUCTS 2019-2027 ($ MILLION)
TABLE 6 NORTH AMERICA METAGENOMICS MARKET BY
COUNTRY 2019-2027 ($ MILLION)
FIGURE 1 NORTH AMERICA METAGENOMICS MARKET
2019-2027 ($ MILLION)
FIGURE 2 NORTH AMERICA METAGENOMICS MARKET BY
SEQUENCING 2019-2027 ($ MILLION)
FIGURE 3 NORTH AMERICA METAGENOMICS MARKET, BY
BIOINFORMATICS, 2019-2027 ($ MILLION)
FIGURE 4 NORTH AMERICA METAGENOMICS MARKET BY GUT
MICROBE CHARACTERIZATION 2019-2027 ($ MILLION)
FIGURE 5 NORTH AMERICA METAGENOMICS MARKET BY
INFECTIOUS DISEASE DIAGNOSIS 2019-2027 ($ MILLION)
FIGURE 6 NORTH AMERICA METAGENOMICS MARKET BY
BIOTECHNOLOGY 2019-2027 ($ MILLION)
FIGURE 7 NORTH AMERICA METAGENOMICS MARKET BY
ENVIRONMENTAL REMEDIATION 2019-2027 ($ MILLION)
FIGURE 8 NORTH AMERICA METAGENOMICS MARKET BY
BIOFUEL 2019-2027 ($ MILLION)
FIGURE 9 NORTH AMERICA METAGENOMICS MARKET BY
AGRICULTURE 2019-2027 ($ MILLION)
FIGURE 10 NORTH AMERICA METAGENOMICS MARKET BY
CONSUMABLES 2019-2027 ($ MILLION)
FIGURE 11 NORTH AMERICA METAGENOMICS MARKET BY
INSTRUMENTS 2019-2027 ($ MILLION)
FIGURE 12 NORTH AMERICA METAGENOMICS MARKET BY SOFTWARE
2019-2027 ($ MILLION)
FIGURE 13 THE UNITED STATES METAGENOMICS MARKET
2019-2027 ($ MILLION)
FIGURE 14 CANADA METAGENOMICS MARKET 2019-2027 ($
MILLION)