

Market By Systems, Application, And Geography | Forecast 2019-2027
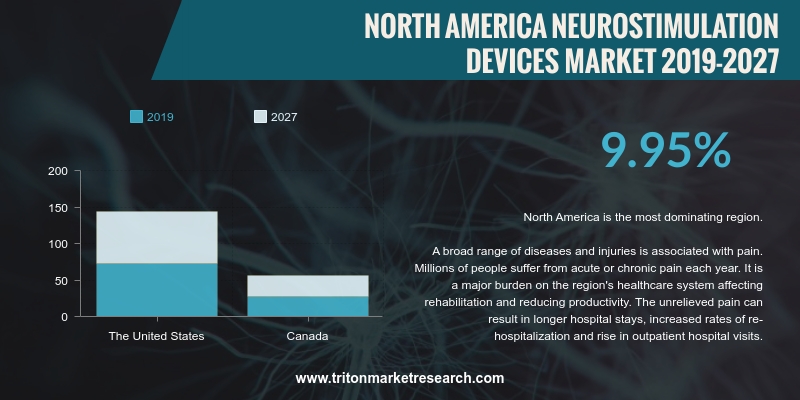
According to the research by Triton, the North America neurostimulation device market is expected to grow significantly in terms of revenue at a CAGR of 9.95% for the forecasting years 2019-2027.
Countries that have been covered in the neurostimulation device market in North America are:
• The United States
• Canada
North America is expected to be the largest market in terms of revenue during the forecasted period. The increased use of neurostimulation devices for treating various diseases such as chronic pain, Parkinson’s disease, epilepsy, and depression has been driving the market growth. In the US, the availability of reimbursement by Medicare boosting the adoption of neurostimulation devices. Along with that, neurostimulation device manufacturing companies are developing innovative products to expand their portfolio and increase the market share of the country.

Report scope can be customized per your requirements. Request For Customization
Moreover, the rapid growth in the population of older people in the US has resulted in the adoption of neurostimulation devices. For instance, according to the Alzheimer’s Association, the number of individuals aged 65 and above suffering from Alzheimer’s disease is predicted to reach around 14 million. This would create massive growth opportunities for the growth of the neurostimulation device market. Furthermore, significant investments made by the government in research & development activities are fueling the neurostimulation device market in the US. The country is estimated to hold the largest market share in the North American region over the forecasted period.
Neuronetics Inc. is a leading medical device company that develops non-invasive therapies for neurological and psychiatric disorders. The company provides the NeuroStar TMS Therapy system, which is used to treat patients suffering from a depressive disorder. The company also offers services such as clinical training, practice support, patient education, and reimbursement support. Neuronetics was founded in 2003 and headquartered in Pennsylvania.
1. NORTH
AMERICA NEUROSTIMULATION DEVICE MARKET – SUMMARY
2. INDUSTRY
OUTLOOK
2.1. MARKET
DEFINITION
2.2. PORTER’S
FIVE FORCES MODEL
2.2.1. THREAT
OF NEW ENTRANTS
2.2.2. THREAT
OF SUBSTITUTES
2.2.3. BARGAINING
POWER OF SUPPLIERS
2.2.4. BARGAINING
POWER OF BUYERS
2.2.5. THREAT
OF RIVALRY
2.3. VALUE
CHAIN OUTLOOK
2.4. MARKET
TRENDS
2.5. MARKET
SHARE OUTLOOK
2.6. PESTLE
OUTLOOK
2.7. MARKET
ATTRACTIVENESS INDEX
2.8. KEY
INSIGHT
2.9. MARKET
DRIVERS
2.9.1. RISING
INCIDENCE OF NEURO DISEASES
2.9.2. INCREASING
GERIATRIC POPULATION
2.9.3. GROWING
DEMAND FOR MRI SCANS
2.9.4. FAVORABLE
REIMBURSEMENT POLICIES
2.10.
MARKET RESTRAINTS
2.10.1.
HIGH COST OF NEUROMODULATION TREATMENT
2.10.2.
PRESENCE OF ALTERNATIVE THERAPY
2.11.
MARKET OPPORTUNITIES
2.11.1.
HIGH MARKET POTENTIAL FOR SCS DEVICES IN
NEUROSTIMULATION
2.11.2.
TECHNOLOGICAL DEVELOPMENT
2.11.3.
GROWING INCIDENCE OF CHRONIC DISCOMFORT
2.12.
MARKET CHALLENGES
2.12.1.
STRINGENT REGULATORY APPROVALS
2.12.2.
SIDE EFFECTS OF ASSOCIATED NEUROSTIMULATION
DEVICES
3. NEUROSTIMULATION
DEVICE MARKET OUTLOOK – BY SYSTEM
3.1. SPINAL
CORD STIMULATORS (SCS)
3.2. DEEP
BRAIN STIMULATORS (DBS)
3.3. SACRAL
NERVE STIMULATORS (SNS)
3.4. VAGUS
NERVE STIMULATORS (VNS)
3.5. GASTRIC
ELECTRIC STIMULATOR
3.6. OTHER
SYSTEMS
4. NEUROSTIMULATION
DEVICE MARKET OUTLOOK – BY APPLICATIONS
4.1. PAIN
MANAGEMENT
4.2. EPILEPSY
4.3. ESSENTIAL
TREMOR
4.4. URINARY
AND FECAL INCONTINENCE
4.5. DEPRESSION
4.6. DYSTONIA
4.7. GASTROPARESIS
4.8. PARKINSON’S
DISEASE
4.9. OTHER
APPLICATIONS
5. NEUROSTIMULATION
DEVICE MARKET – REGIONAL OUTLOOK
5.1.1. COUNTRY
ANALYSIS
5.1.1.1. THE
UNITED STATES
5.1.1.2. CANADA
6. COMPANY
PROFILES
6.1. NEURONETICS,
INC.
6.2. ST.
JUDE MEDICAL, INC. (ACQUIRED BY ABBOTT LABORATORIES)
6.3. HOCOMA
AG
6.4. NEVRO
CORP.
6.5. CYBERONICS
INC.
6.6. COGENTIX
MEDICAL, INC.
6.7. DEPUY
SYNTHES COMPANIES
6.8. DR.
LANGER MEDICAL GMBH
6.9. MEDTRONIC
PLC
6.10.
THE MAGSTIM COMPANY LIMITED
6.11.
ECTRON LIMITED
6.12.
BOSTON SCIENTIFIC CORPORATION
6.13.
EKSO BIONICS HOLDING INC.
6.14.
ALEVA NEUROTHERAPEUTICS SA
6.15.
HELIUS MEDICAL TECHNOLOGIES
7. RESEARCH
METHODOLOGY & SCOPE
7.1. RESEARCH
SCOPE & DELIVERABLES
7.1.1. OBJECTIVES
OF STUDY
7.1.2. SCOPE
OF STUDY
7.2. SOURCES
OF DATA
7.2.1. PRIMARY
DATA SOURCES
7.2.2. SECONDARY
DATA SOURCES
7.3. RESEARCH
METHODOLOGY
7.3.1. EVALUATION
OF PROPOSED MARKET
7.3.2. IDENTIFICATION
OF DATA SOURCES
7.3.3. ASSESSMENT
OF MARKET DETERMINANTS
7.3.4. DATA
COLLECTION
7.3.5. DATA
VALIDATION & ANALYSIS
TABLE 1 NORTH AMERICA NEUROSTIMULATION DEVICE MARKET 2019-2027 ($
MILLION)
TABLE 2 NORTH AMERICA NEUROSTIMULATION DEVICE MARKET BY SYSTEM
2019-2027 ($ MILLION)
TABLE 3 NORTH AMERICA NEUROSTIMULATION DEVICE MARKET BY APPLICATIONS
2019-2027 ($ MILLION)
TABLE 4 CONDITION TREATED BY NEUROSTIMULATION DEVICES IN THE UNITED
STATES
TABLE 5 NORTH AMERICA NEUROSTIMULATION DEVICE MARKET BY COUNTRY
2019-2027 ($ MILLION)
FIGURE 1 NORTH AMERICA NEUROSTIMULATION DEVICE
MARKET 2019-2027 ($ MILLION)
FIGURE 2 VALUE CHAIN OUTLOOK
FIGURE 3 NEUROSTIMULATION DEVICE COMPANY MARKET
SHARE OUTLOOK 2018 (%)
FIGURE 4 NORTH AMERICA NEUROSTIMULATION DEVICE
MARKET BY SPINAL CORD STIMULATORS 2019-2027 ($ MILLION)
FIGURE 5 NORTH AMERICA NEUROSTIMULATION DEVICE
MARKET BY DEEP BRAIN STIMULATORS 2019-2027 ($ MILLION)
FIGURE 6 NORTH AMERICA NEUROSTIMULATION DEVICE
MARKET BY SACRAL NERVE STIMULATORS 2019-2027 ($ MILLION)
FIGURE 7 NORTH AMERICA NEUROSTIMULATION DEVICE
MARKET BY VAGUS NERVE STIMULATORS 2019-2027 ($ MILLION)
FIGURE 8 NORTH AMERICA NEUROSTIMULATION DEVICE
MARKET BY GASTRIC ELECTRIC STIMULATOR 2019-2027 ($ MILLION)
FIGURE 9 NORTH AMERICA NEUROSTIMULATION DEVICE
MARKET BY OTHER SYSTEM 2019-2027 ($ MILLION)
FIGURE 10 NORTH AMERICA NEUROSTIMULATION DEVICE MARKET
BY PAIN MANAGEMENT 2019-2027 ($ MILLION)
FIGURE 11 NORTH AMERICA NEUROSTIMULATION DEVICE MARKET
BY EPILEPSY 2019-2027 ($ MILLION)
FIGURE 12 NORTH AMERICA NEUROSTIMULATION DEVICE MARKET
BY ESSENTIAL TREMOR 2019-2027 ($ MILLION)
FIGURE 13 NORTH AMERICA NEUROSTIMULATION DEVICE MARKET
BY URINARY AND FECAL INCONTINENCE 2019-2027 ($ MILLION)
FIGURE 14 NORTH AMERICA NEUROSTIMULATION DEVICE MARKET
BY DEPRESSION 2019-2027 ($ MILLION)
FIGURE 15 NORTH AMERICA NEUROSTIMULATION DEVICE MARKET
BY DYSTONIA 2019-2027 ($ MILLION)
FIGURE 16 NORTH AMERICA NEUROSTIMULATION DEVICE MARKET
BY GASTROPARESIS 2019-2027 ($ MILLION)
FIGURE 17 NORTH AMERICA NEUROSTIMULATION DEVICE MARKET
BY PARKINSON’S DISEASE 2019-2027 ($ MILLION)
FIGURE 18 NORTH AMERICA NEUROSTIMULATION DEVICE MARKET
BY OTHER APPLICATIONS 2019-2027 ($ MILLION)
FIGURE 19 THE UNITED STATES NEUROSTIMULATION DEVICE
MARKET 2019-2027 ($ MILLION)
FIGURE 20 CANADA NEUROSTIMULATION DEVICE MARKET
2019-2027 ($ MILLION)